

Measurement and Analytics
Your Tracking Is Costing You Money: A Practical Guide to Data Maturity
Meta shows $80K. Google shows $60K. Your store shows $100K. If your team treats all three as true, you have a problem.
.png)
Meta shows $80K. Google shows $60K. Your store shows $100K. If your team treats all three as true, you have a problem.

Most brands with a tracking problem don't know they have one. Their dashboards show numbers, their reports get sent on time, and decisions get made every week based on the data available. The issue is not that the data is missing. It's that the data is wrong, incomplete, or inconsistent in ways that are hard to spot from the inside.
Bad tracking doesn't announce itself. It quietly distorts every decision you make. You scale campaigns that look profitable but aren't. You kill campaigns that look inefficient but are actually driving real growth. You misread what's working and double down on what isn't.
If you're spending serious money on paid media and your tracking infrastructure hasn't been properly audited, there's a good chance it's costing you more than you realise.
For example, Meta might show $80,000 in attributed revenue, Google might show $60,000, and your store might show $100,000 in total revenue for the same period. If the team treats each platform number as independently true, the business starts making budget decisions from a version of reality that does not exist.
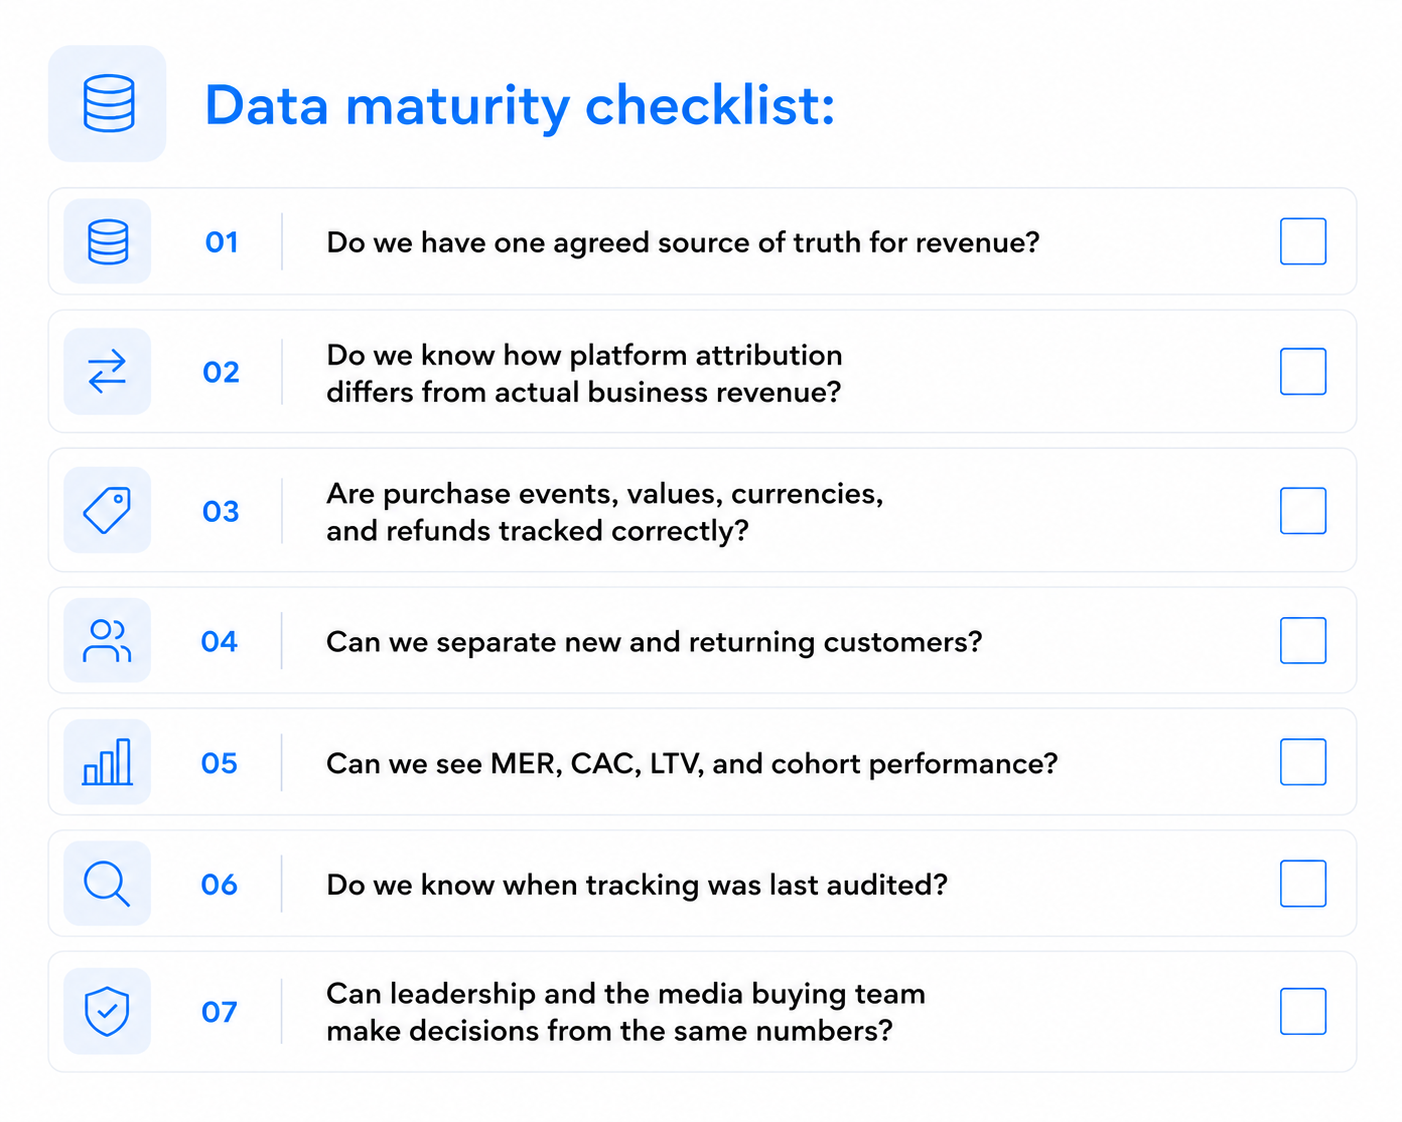
Data maturity is not about having the most sophisticated tech stack. It's about having reliable, consistent, accessible data that you can actually make decisions from.
A mature data setup has a few defining characteristics. There is a single source of truth. When your Meta dashboard, your Google Analytics, and your internal reporting show different numbers, someone in the business has to decide which one to believe. That decision is made differently by different people, and over time it creates inconsistency in how performance is evaluated and how budget is allocated.
The data is consistent over time. If your tracking setup changes frequently, whether due to platform updates, new tools being added, or attribution windows being adjusted, you lose the ability to compare performance across periods. A number from three months ago means something different from the same number today, and you may not even know it.
The data captures what matters. Revenue and ROAS are the starting point, not the finish line. A mature setup gives you visibility into MER, CAC by channel, LTV by cohort, and new versus returning customer splits. Without these, you're making growth decisions based on a fraction of the information you need.
Platform attribution inflation is the most widespread issue. Meta, Google, and TikTok all want to take credit for conversions, and their default attribution settings are designed to do exactly that. When you add up the attributed revenue across all your platforms, it will almost always exceed your actual revenue. Brands that don't account for this end up with an inflated view of performance and make scaling decisions based on numbers that don't reflect reality.
Broken or inconsistent pixel and conversion event setup is more common than most brands expect. Events fire incorrectly, purchase values get pulled from the wrong data layer, or tracking breaks after a site update and nobody notices for weeks. The result is data that looks complete but isn't.
Over-reliance on last-click attribution misses the contribution of upper funnel activity entirely. A customer who saw a video ad, engaged with a retargeting ad, and then converted through a branded search click will often be attributed entirely to the search click. The video ad that started the journey gets no credit, which leads to systematic underinvestment in awareness.
Manual reporting creates its own problems. When performance data lives in spreadsheets that someone updates by hand, errors creep in, updates get delayed, and the version of the truth that different people are working from diverges over time.
Start with a simple question: if three different people in your business pulled the revenue number for last month from your data, would they get the same answer? If the answer is no, or if you're not sure, that's where to start.
From there, look at your platform attribution versus your actual revenue. Pull the attributed revenue from every paid channel for a given month and add it up. Compare it to your actual revenue for that period. The gap between those two numbers tells you a lot about how inflated your platform data is.
Check when your tracking was last properly audited. Not updated, audited. Someone should have gone through every conversion event, every attribution setting, and every data source to verify that what's being measured reflects what's actually happening.
The brands with mature data setups share a few common traits. They have a centralized reporting tool, whether that's Triple Whale, Northbeam, or a custom Tableau setup, that pulls from all sources and provides a single view of performance. They use MER as their primary efficiency metric rather than platform-reported ROAS. They review tracking integrity regularly, not just when something looks wrong.
They document definitions. For example, what counts as revenue? Gross or net? Before or after refunds? VAT included or excluded? New customer revenue or total revenue? This matters a lot once teams start making budget decisions from the data.
Most importantly, they make decisions quickly because they trust the data. They're not spending half their time questioning whether the numbers are right. They're spending that time acting on what the numbers are telling them.
"Tracking is not a technical detail. It is part of the growth system. If the numbers are unreliable, every decision downstream becomes weaker: budget allocation, creative testing, channel mix, forecasting, and scaling. If you can't measure it reliably, you can't scale it."


.png)
